Multiplication Chart — Free Printable Times Tables
Looking for a multiplication chart you can actually use? You’re in the right place. This page has every chart you need — from a simple 1 to 12 times table to a full 1 to 100 grid. Every chart is free to download as a PDF, and you don’t need to sign up or hand over your email.
Whether you’re a parent helping with homework, a teacher setting up your classroom wall, or a student working through your times tables — we built this page for you.
What Is a Multiplication Chart?
A multiplication chart is a grid that shows the answers when you multiply two numbers together. The numbers along the top row and the left column are the factors. The spot where a row and column meet gives you the product — that’s your answer.
Think of it like a cheat sheet that organizes every multiplication fact into one clean layout. Instead of memorizing hundreds of facts out of thin air, you can see them all at once, spot patterns, and build your memory step by step.
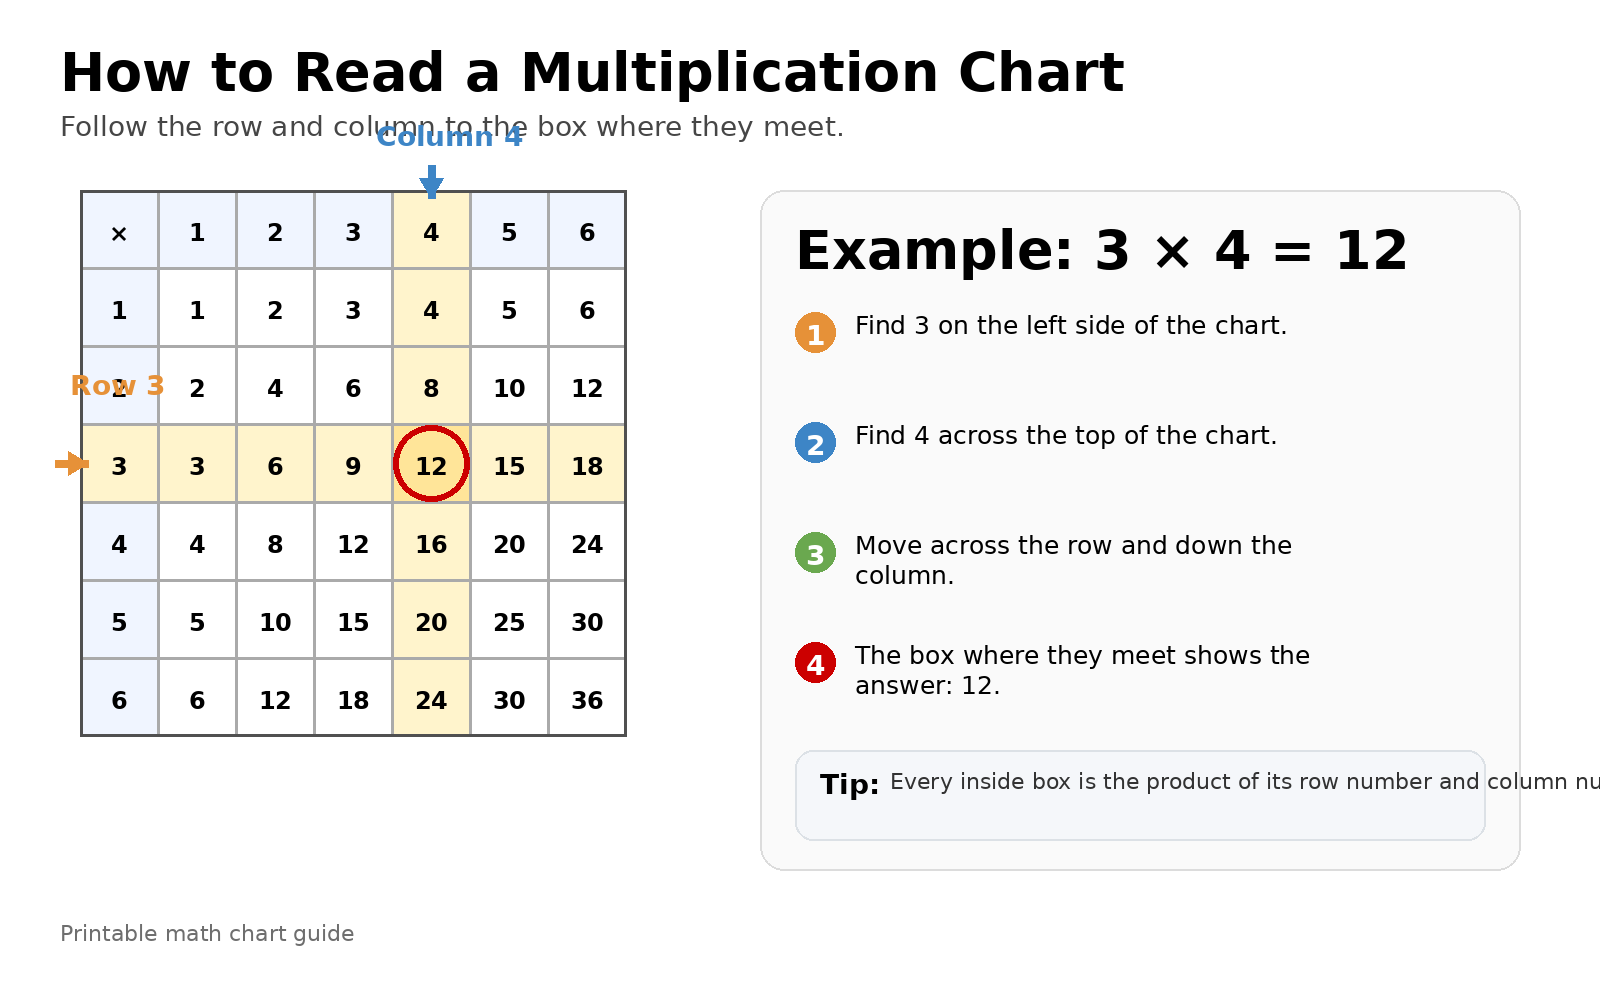
How to Read a Multiplication Chart
Reading a multiplication chart takes about 10 seconds to learn. Here’s how it works:
- Step 1: Pick the first number you want to multiply. Find it on the left column.
- Step 2: Pick the second number. Find it on the top row.
- Step 3: Follow the row from your first number across, and the column from your second number down. The box where they meet is your answer.
For example, if you want to find 7 × 8, go to 7 on the left side and 8 on the top. Where they meet, you’ll see 56. That’s it.

Here’s something that makes multiplication charts even more useful: the order of the numbers doesn’t change the answer. This is called the commutative property. So 7 × 8 and 8 × 7 both equal 56. That one fact alone cuts your memorization work almost in half.
Why Use a Multiplication Chart?
Multiplication charts do more than just hand you answers. They help in a few important ways:
- Pattern recognition — When you look at a chart, patterns jump out. The 5s column always ends in 0 or 5. The 9s column has digits that add up to 9. These patterns make facts easier to remember.
- Building math fluency — Students who use charts regularly start recalling facts faster. The chart acts like training wheels — helpful at first, then no longer needed.
- Self-checking — Working through a worksheet? A chart lets you double-check your answers without asking someone else.
- Foundation for harder math — Division, fractions, and algebra all depend on knowing your multiplication facts. A chart helps you lock those facts in early.
Free Printable Multiplication Charts — Every Range You Need
Below you’ll find multiplication charts in every common range. Each one is ready to download as a high-quality PDF — completely free, no strings attached. We’ve included color versions, black and white versions, and blank versions where available.
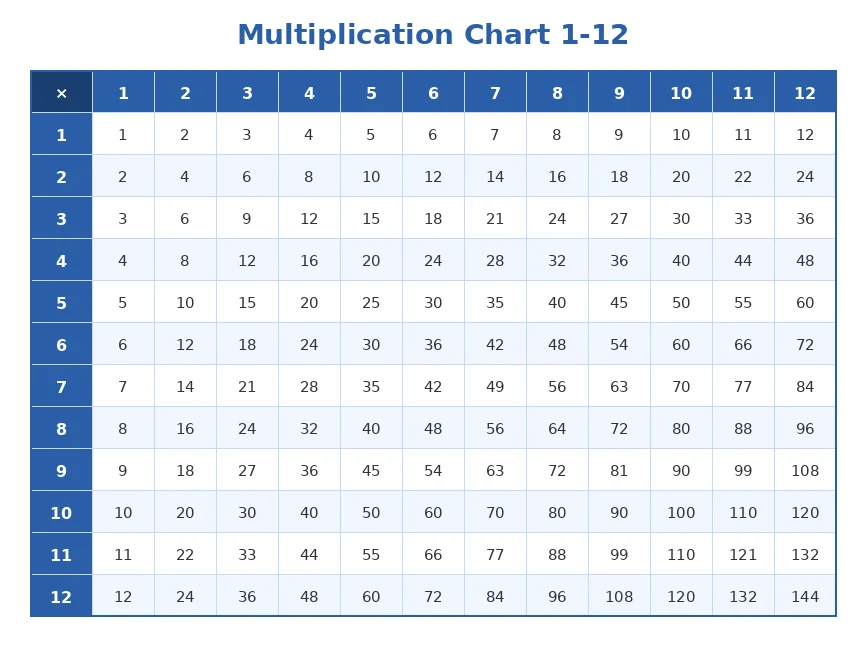
Multiplication Chart 1-12
The 1 to 12 multiplication chart is the standard. It’s what most schools use, and it covers the core times tables that students need from 2nd grade through 5th grade. This 12 by 12 grid holds 144 multiplication facts — the building blocks for everything that comes after.
If you’re not sure which chart to grab, start here. The 1-12 range covers what students are tested on in most math programs, and it’s the right size for a classroom poster or a desk reference sheet.

Multiplication Chart 1-10
The 1 to 10 chart is perfect for younger students just getting started with multiplication. It keeps things simple — a clean 10 by 10 grid with 100 facts and no extra clutter.
For 2nd and 3rd graders, this smaller chart feels less overwhelming. Kids can focus on learning the basics without feeling lost in a sea of numbers. Once they’ve mastered this range, stepping up to a 1-12 chart feels natural.

Multiplication Chart 1-15
Ready to move past the standard 12 times table? The 1 to 15 chart takes students one step further. It’s a great fit for 4th graders who have already nailed their 1-12 facts and want to push ahead.
This range also helps students notice new patterns. For instance, the 13s, 14s, and 15s connect back to facts they already know — and recognizing those connections builds number sense.

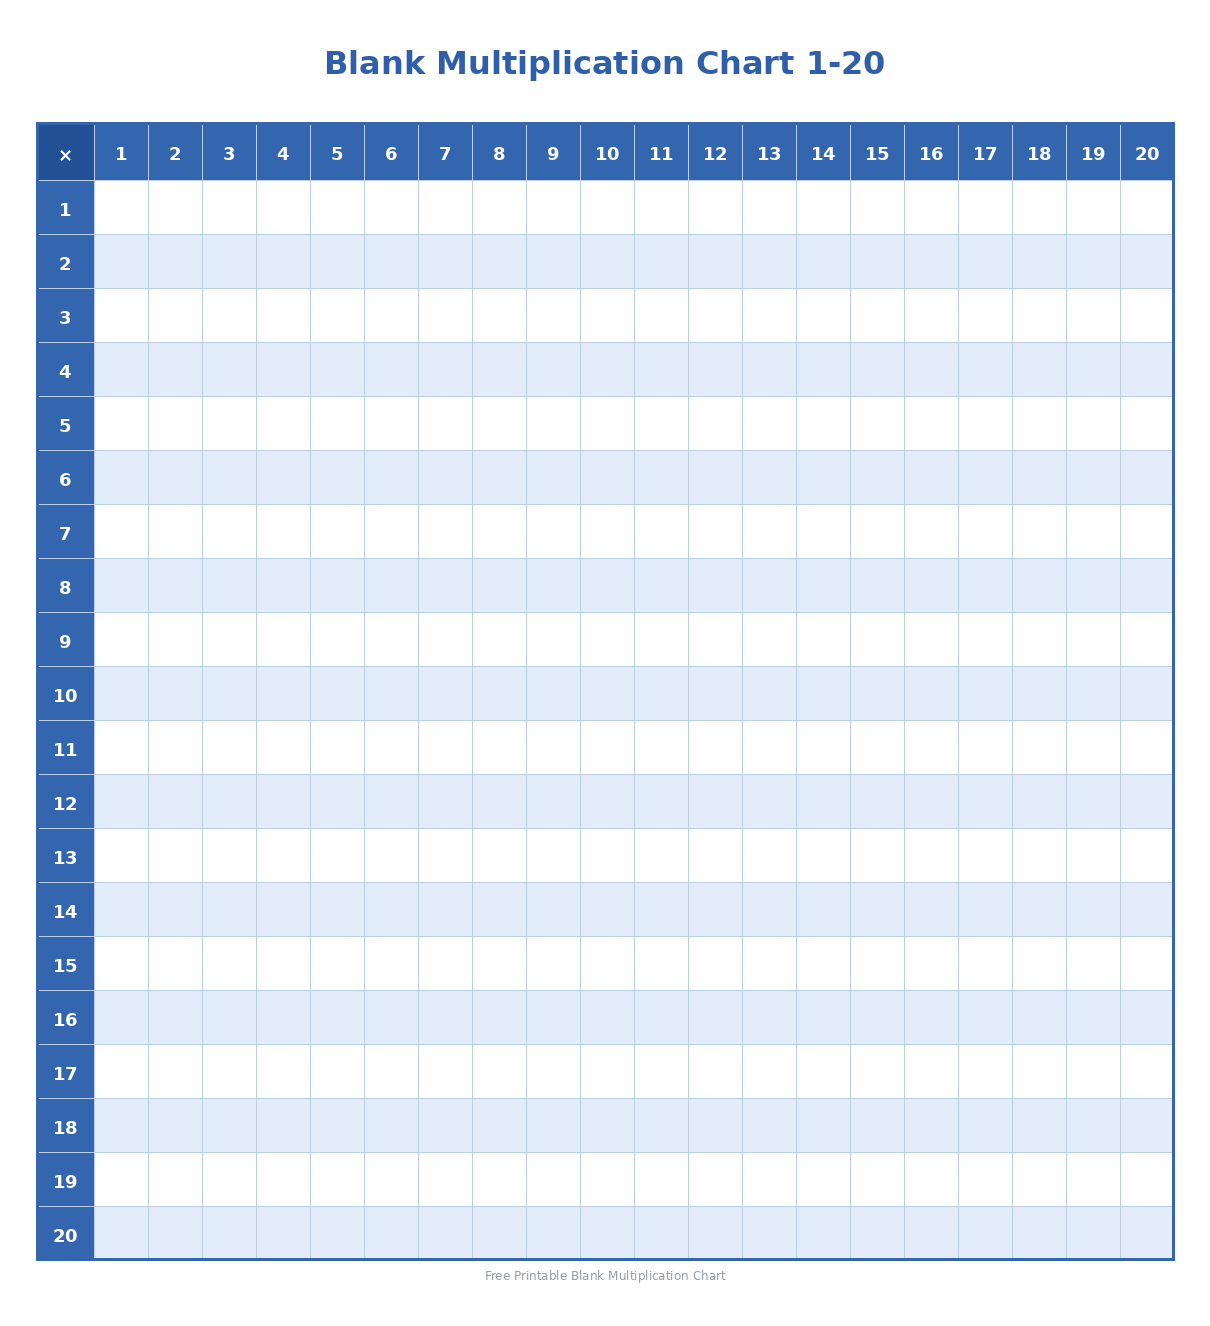
Multiplication Chart 1-20
The 1 to 20 multiplication chart is popular with parents and teachers who want students to go beyond the basics. This 20 by 20 grid covers 400 facts and gives learners a wider view of how multiplication works at higher numbers.
It’s especially useful for 5th and 6th graders preparing for pre-algebra, where knowing your facts up to 20 saves real time on tougher problems. Many homeschool families also prefer this range because it covers more ground in fewer sessions.

Multiplication Chart 1-25
A 1 to 25 chart is less common but highly useful. This colorful 25 by 25 grid helps students see how multiplication scales up and makes connections between two-digit factors. It’s also a great reference for mental math practice.

Multiplication Chart 1-30
The 1 to 30 chart is where things get serious. With 900 products in a single grid, this chart is built for students who are comfortable with basic multiplication and ready to explore how larger numbers interact.
Teachers sometimes use this chart for pattern-finding activities. Students can highlight multiples of specific numbers across the grid and see how multiplication creates repeating sequences — even with bigger factors.

Multiplication Chart 1-50
Need a chart that goes further? The 1 to 50 multiplication chart covers 2,500 products and works as a reference tool more than a memorization aid. It’s ideal for middle school students, homeschool families covering advanced arithmetic, or anyone who wants quick access to higher multiplication facts.
Because of its size, this chart prints best on larger paper or as a zoomable PDF.

Multiplication Chart 1-100
The 1 to 100 multiplication chart is the complete reference. With 10,000 products in a massive grid, this chart covers every basic multiplication fact up to 100 × 100. It’s not something you’d hang on a wall for memorization — it’s a lookup tool.
Students working on multi-digit multiplication, long division, or factoring will find this chart helpful when they need a quick answer without pulling out a calculator. It’s also popular with math enthusiasts who enjoy spotting patterns across a large dataset.

Multiplication Chart 1-1000
Let’s be honest — a full 1000 × 1000 grid would be unreadable on any screen or paper. But that doesn’t mean a 1-1000 reference is impossible.
Our 1-1000 multiplication reference PDF organizes the key tables (1 through 20 multiplied up to 1000) in a clean, scrollable layout. It’s designed for students and professionals who need to look up larger products without reaching for a calculator every time.
Blank Multiplication Charts — Printable Practice Sheets
A blank multiplication chart is one of the simplest and most effective practice tools out there. Instead of just reading answers off a filled chart, students write the answers themselves. That extra step — recalling the answer from memory and writing it down — is what turns short-term knowledge into long-term recall.
Teachers use blank charts for classroom quizzes, timed drills, and weekly check-ins. Parents use them at home to track progress. And students use them to build genuine confidence.
Here’s a method that works: have your child fill in one row or one column per day. Start with the easier tables (2s, 5s, 10s) and work toward the harder ones (6s, 7s, 8s). Within a few weeks, the entire chart fills in from memory.

Which Multiplication Chart Is Right for Your Child’s Grade?
One question parents ask all the time: “Which chart should I get for my kid?” The answer depends on where they are in school and what they’re working on right now. Here’s a quick guide:
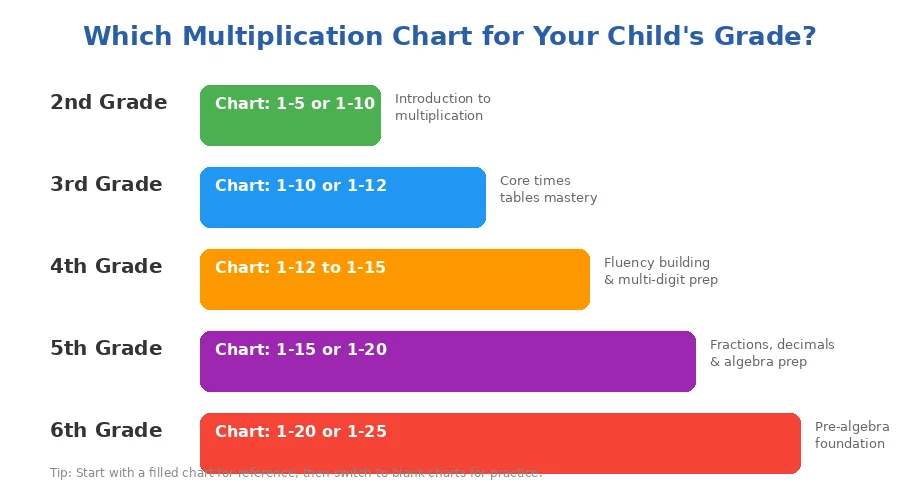
- 2nd Grade — Start with a 1-5 or 1-10 chart. At this stage, students are just being introduced to the idea of multiplication as repeated addition. Keep it simple. A 10 × 10 grid with bright colors works best for keeping young learners engaged without overwhelming them.
- 3rd Grade — Move to a 1-10 or 1-12 chart. Third grade is where most schools begin serious multiplication instruction. Students should be working toward memorizing the facts through 10 and getting familiar with 11s and 12s by the end of the year.
- 4th Grade — Use a 1-12 chart for mastery, and introduce a 1-15 chart for extra challenge. By fourth grade, students should have most of their basic facts memorized. The focus shifts to fluency — being able to recall facts quickly and accurately, especially during multi-digit multiplication.
- 5th Grade — A 1-15 or 1-20 chart is ideal. Fifth graders are applying multiplication to fractions, decimals, and early algebraic thinking. Having solid facts through 20 gives them the speed they need to handle more complex problems.
- 6th Grade — A 1-20 or 1-25 chart supports pre-algebra preparation. Students at this level benefit from seeing how multiplication extends beyond the basics, which builds the number sense needed for middle school math.
Interactive Multiplication Chart
Sometimes a printable chart isn’t enough. If your child learns better by doing — by clicking, tapping, and seeing things light up on screen — our interactive multiplication chart is built for that.
Interactive Multiplication Chart
Tap any cell to highlight its row, column, and product. Switch between blank and filled mode, and change the chart range anytime.
How it works:
Pick any number on the top row or left column, and the chart highlights the entire row and column in color. The answer box shows the full equation. It’s a fast, visual way to explore multiplication patterns and test yourself at the same time.
Features:
Switch between a filled chart (for learning) and a blank chart (for testing). Choose your range — 1 to 10, 1 to 12, or 1 to 20. Works on phones, tablets, and computers.
Teachers can project this on a classroom screen and walk through patterns as a group. Parents can hand their kid a tablet and let them explore on their own. Either way, it’s a hands-on approach that sticks better than just staring at a printed page.
How to Learn Multiplication Tables Fast — Tips and Tricks
A multiplication chart is a tool, but knowing how to use it makes all the difference. Here are the strategies that actually work — based on how memory and learning function, not just what sounds good.
Start With the Easy Tables
Don’t try to learn everything at once. Begin with the tables that have clear, obvious patterns:
- 1s — Anything times 1 stays the same. Done.
- 2s — Double the number. If your child can add a number to itself, they’ve got the 2s table.
- 5s — Every answer ends in 0 or 5. Count by fives and you’ll land on every product.
- 10s — Add a zero. 10 × 7 = 70. It doesn’t get simpler than that.
Once these four tables feel automatic, move to the 3s, 4s, and 9s. The 9s have an especially helpful pattern — the digits in the answer always add up to 9 (for products up to 90). So 9 × 4 = 36, and 3 + 6 = 9. That pattern alone makes the 9s table one of the fastest to memorize.
Save the 6s, 7s, and 8s for last. These are the toughest for most kids. But here’s the good news: by the time you get to them, you’ve already learned most of the facts through the commutative property. For example, if you already know 4 × 7 = 28 from learning the 4s table, then you automatically know 7 × 4 = 28 too.
Cut the Work in Half With the Commutative Property
Here’s a fact that surprises many students: a standard 12 × 12 chart holds 144 facts, but you only need to memorize about half of them. Since 3 × 8 and 8 × 3 give the same answer, learning one means you’ve learned both.
Focus on the triangle above (or below) the diagonal line of perfect squares on the chart. That’s where the unique facts live. Everything on the other side is a mirror image.

Spot the Patterns
Patterns are your shortcut to faster memorization. Here are the ones worth pointing out to your child:
- 9s pattern — The tens digit goes up by 1, the ones digit goes down by 1. So: 09, 18, 27, 36, 45, 54, 63, 72, 81, 90. Also, the two digits always add up to 9.
- 5s pattern — Answers alternate between ending in 5 and ending in 0.
- 11s shortcut (1-9) — Just repeat the digit. 11 × 3 = 33. 11 × 7 = 77.
- Perfect squares — The diagonal of the chart (1, 4, 9, 16, 25, 36, 49, 64, 81, 100, 121, 144) is worth memorizing on its own. These come up constantly in higher math.
- Even × anything = even — Any time one of the factors is even, the product is even. This helps with estimation and error-checking.
Practice Methods That Actually Stick
Knowing the tricks is one thing. Getting the facts into long-term memory takes practice. Here’s what works:
Fill in a blank chart daily. Set a timer for 5 minutes and see how much of the chart your child can complete from memory. Do this every day for two weeks and you’ll see a real difference.
Use flashcards alongside the chart. The chart shows you the answer. Flashcards test whether you actually know it. Use both together — chart for learning, flashcards for testing.
Skip counting out loud. Saying “5, 10, 15, 20, 25…” out loud builds an audio memory that pairs with the visual one from the chart.
Make it real. At the grocery store: “We need 6 boxes and each costs $4 — what’s the total?” In the kitchen: “The recipe says 3 cups, and we’re making a double batch.” Real-world multiplication makes abstract facts feel practical.
Common Mistakes to Watch For
A few pitfalls trip students up more than any difficult fact:
Relying on the chart too long. The chart is a learning tool, not a permanent crutch. Set a goal: use the chart for reference during the first few weeks, then switch to blank charts and flashcards for active recall.
Skipping the hard tables. Most kids are comfortable with 2s, 5s, and 10s early on. The danger is spending all your time on easy tables and never tackling 6s, 7s, and 8s. Build these into your rotation early, even if they’re slower.
Not understanding the concept. Memorizing 6 × 4 = 24 is good. Knowing that 6 × 4 means “6 groups of 4” is better. Students who understand the concept behind multiplication — repeated addition — can figure out facts they’ve forgotten and apply multiplication to word problems more easily.
Misreading the chart. On larger charts, it’s easy for eyes to drift to the wrong row or column. Using a ruler, a finger, or a highlighted row helps younger students track accurately.
Individual Times Tables — 1 Through 12
Sometimes you don’t need the whole chart. You just need to focus on one specific table until it clicks. Below are quick links to individual times tables, each with its own mini chart, practice tips, and downloadable sheet.
| 1 Times Table | 2 Times Table | 3 Times Table | 4 Times Table |
| 5 Times Table | 6 Times Table | 7 Times Table | 8 Times Table |
| 9 Times Table | 10 Times Table | 11 Times Table | 12 Times Table |
Each page includes a focused chart for that specific table, a quick pattern tip, and a printable practice sheet. Start with the table your child finds most challenging.
Download All Multiplication Charts — Free PDF and PNG
Every chart on this page is available as a free download. No email required. No signup forms. Just click, download, and print.
We’ve organized everything in one place so you can grab exactly what you need in one visit. Charts are available in US Letter and A4 paper sizes.
Color Charts (US Letter)
Black & White Charts (US Letter)
Blank Practice Charts (US Letter)
A4 Size Charts
PNG Images (for web display)
Special Images
| Image | File |
|---|---|
| How to Read (annotated) | Download How To Read Chart PNG |
| Commutative Property Visual | Download Chart’s Commutative Property PNG |
| Grade Level Guide | Download Chart’s Grade Guide PNG |
1-1000 Reference
Printing tips: For charts up to 1-20, standard letter-size paper works great. For 1-30 and larger, consider printing on legal-size paper or using the “fit to page” option in your printer settings. The 1-100 chart prints best on 11×17 paper or as a multi-page PDF.
Frequently Asked Questions
What is a multiplication chart?
A multiplication chart is a grid that shows the product of two numbers. Numbers are listed across the top row and down the left column. The cell where any row and column meet shows the result of multiplying those two numbers together. It’s one of the most common tools for learning and practicing times tables.
How do you read a multiplication chart?
Find one number on the left column and the other on the top row. Trace the row and column with your finger until they meet. The number in that cell is the answer. For example, to find 6 × 9, go to row 6 and column 9 — the answer is 54.
Is a multiplication chart the same as a times table?
They’re closely related but slightly different in format. A times table usually shows one number’s multiplication facts in a list (like 3 × 1 = 3, 3 × 2 = 6, and so on). A multiplication chart puts all the tables together into one grid, making it easy to compare and find patterns across different tables.
What is the best multiplication chart for 3rd graders?
A 1 to 10 or 1 to 12 chart works best for most 3rd graders. This covers the core times tables that 3rd-grade math programs focus on. A color version makes it easier for younger students to track rows and columns without getting lost.
How can a multiplication chart help with division?
Multiplication and division are inverse operations. If you know that 8 × 7 = 56, you also know that 56 ÷ 7 = 8 and 56 ÷ 8 = 7. A multiplication chart gives you a quick way to find these relationships. Just locate the product in the body of the chart and trace back to the row and column to find the factors.
What size multiplication chart should I use?
It depends on the student’s level. Beginners do well with a 1-10 chart. Most elementary students need a 1-12 chart. Students preparing for middle school benefit from a 1-20 chart. For reference purposes, a 1-100 chart covers virtually any basic multiplication lookup you’d need.
Does the order of numbers matter in multiplication?
No. Multiplication is commutative, which means 4 × 9 gives the same answer as 9 × 4. Both equal 36. This is actually good news — it means you only need to memorize about half the facts on the chart, and you’ll know the other half automatically.
When was the multiplication table invented?
Multiplication tables have been around for thousands of years. The oldest known examples date back to ancient Babylon, roughly 4,000 years ago. The grid format we use today became popular much later, but the idea of organizing multiplication facts for quick reference has been part of math education for centuries.
How can I help my child memorize multiplication tables?
Start with the easiest tables (1s, 2s, 5s, 10s) and build from there. Use a combination of a filled chart for reference and a blank chart for practice. Short daily sessions of 5 to 10 minutes are more effective than one long study session per week. Flashcards, skip counting, and real-world examples (like calculating prices while shopping) also speed up memorization.
What are the hardest multiplication facts to learn?
Research and teacher experience both point to the same group: 6 × 7, 6 × 8, 7 × 8, and 8 × 8 are the facts most students struggle with the longest. These involve larger numbers without the helpful patterns found in the 5s, 9s, or 10s. Focused practice on these specific facts makes a big difference.
Can I use a multiplication chart on a test?
That depends on the test and the teacher. Some assessments allow reference charts, especially for younger students or students with accommodations. Others require facts to be recalled from memory. Check with your child’s teacher or the test guidelines to know for sure.
What is a blank multiplication chart used for?
A blank multiplication chart has the grid structure and the factor numbers along the top and side, but the product cells are empty. Students fill in the answers from memory. It’s one of the best practice tools available because it forces active recall — which is how facts actually move into long-term memory.
Final Thoughts
A multiplication chart isn’t just a piece of paper with numbers on it. It’s a learning tool that helps students build a skill they’ll use for the rest of their lives. From basic grocery math to advanced algebra, knowing your times tables makes everything easier and faster.
We made this page because we noticed something: most sites give you either a printable chart or an interactive tool or a guide on how to learn. We wanted to put everything in one place — every range, every format, and the practical advice to go with it.
Bookmark this page, download the charts you need, and come back whenever you need a different range or a fresh set of blank practice sheets. Everything here is free, and it always will be.